Biking! It’s exercise. It extends your lifespan and makes you happier. It is better for the environment and your community. It is more affordable than private car use, and efficient to boot.
As a company that believes in the vibrant future of transportation, TransLoc knows biking is integral to having a variety of affordable transportation options. We believe in public transportation; we’ve built our business on public transit being the backbone of the transportation network. Yet, the bus and subway aren’t the only solutions – we cannot fully succeed if our cities tacitly prohibit walking and biking. Similarly to the topic of public transportation, when biking comes up people often say something along the lines of, “I’d love to bike to work, but…” Their rationale sounds virtually identical to the reasons people don’t take the bus — it takes too long, it is not convenient. But biking has an extra hurdle preventing mass adoption — most people don’t feel safe riding their bikes on our streets.
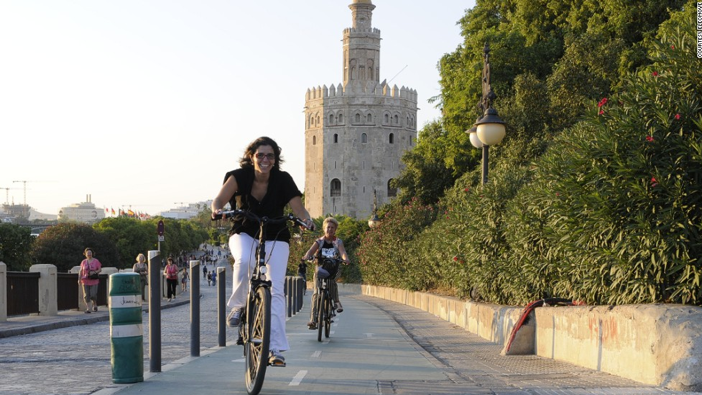
♫ Let me tell you about Seville ♫
In 2006 Seville, Spain did not have a biking culture to speak of, but within a couple of years it became the biking capital of Spain. The country of Spain has one of the lowest rates of biking in Europe — there is not a culture of biking there like in many other European cities. But Seville dramatically changed despite that reputation. Some might now refer to Seville as an outright biking mecca. By 2007, 40 new bike shops opened and practically everyone received bikes for Christmas. It felt as is the city was evolving overnight. But why the sudden shift?
The city built 40 miles of protected bike infrastructure in one year, and 10 additional miles in 2008.
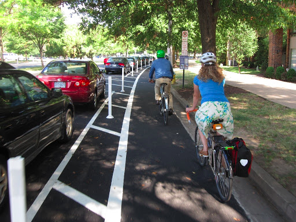
Protected versus unprotected bike lanes
This infrastructure was built on existing streets, often by removing a parking lane, and creating physically separated bike paths in the city. Imagine riding on a wooded trail, but in a city.
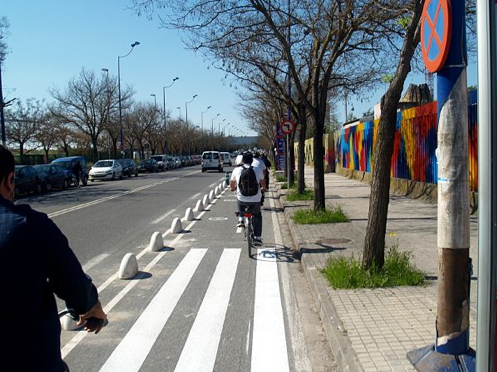
The above image shows the value of protected bike lanes. Similar to the tree lining, which separates the sidewalk from motor traffic, the bike lane has physical barriers to designate a specific purpose.
Building this network radically changed Seville’s pulse and everyday life because thousands of people started biking everywhere. The way transportation planners measure the prevalence of a given transportation option is called mode share. It is an imperfect method for quantifying how much a particular mode (car, bus, bike, toboggan) is used in a given place.1 In 2006, Seville had a bicycling mode share around 0.4%. For context, that’s the same mode share as Durham, North Carolina. But within a few years, Seville’s mode share grew from 0.4% to 7% — the same mode share as Portland, Oregon, considered one of the most bikeable cities in the U.S.2 To understand this level of increase, from now on, every time you see someone biking on the road, imagine there are 17 bikers behind them. For bonus points, imagine 17 fewer people in cars on the road.
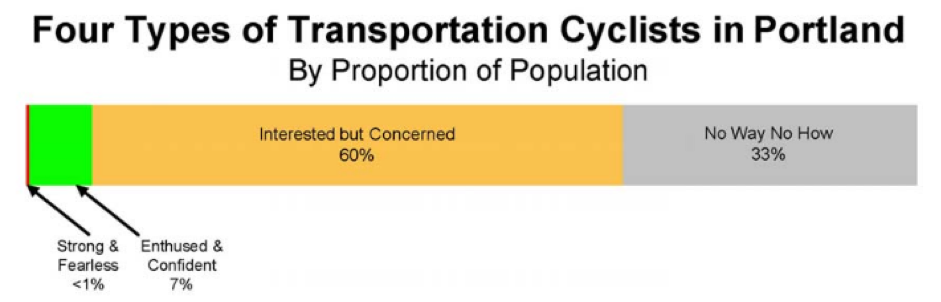
That is the kind of one-pill-daily-for-fast-results stuff you can sell on daytime television! Mayors all over the U.S. would break their moral codes for these kinds of outcomes, and Seville even achieved this at a low-cost. All 50 miles of the bike network cost the same as 5 or 6 miles of highway.3 On-street protected bike lanes are pennies on the dollar compared to boondoggles like Musk’s hyperloop or even adding lanes to a highway. It turns out that there is a massive latent demand for biking. One study in Portland identified that a majority of the population would like to bike but doesn’t feel safe.
 4
4
Why Is Seville Different?
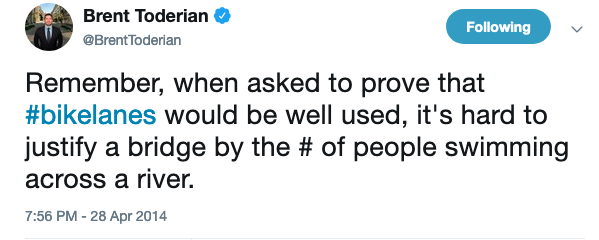
Why is it that building bike lanes so dramatically changed the mode share in Seville? Where were these bikers before? If demand were so high, why wasn’t this built sooner? Or why weren’t people clamoring for it? In the startup world, it is important to constantly remind ourselves that just because we build something, it doesn’t mean someone will use it. Strewn out on dusty ping pong tables, many fatal startups use their final breath to croak out “Field of Dreams was a lie!” But as it turns out, what isn’t true for entrepreneurs is for infrastructure; if you build it, they will come.
The data are clear — when we widen roads and highways, cars flock to them.5 In Seville’s case, this is inarguable for protected bike lanes — they built the network and people started biking.
So why then, are other cities not seeing similar results as they build their own bike lanes? There are plenty of cities in the U.S. that have consistently been increasing miles of bike lanes.
Since I mentioned it earlier, let’s look at Durham, NC as an example of Anywhere, USA. Similar to Seville in 2006, Durham had a 0.5% bicycle mode share. At that time, Durham had 13.8 miles of bike lanes. Thirteen years later in 2019, Durham has matched Seville’s 50 miles of bike lanes, but it’s bicycle mode share has only grown to 0.7%. Where is the disconnect?
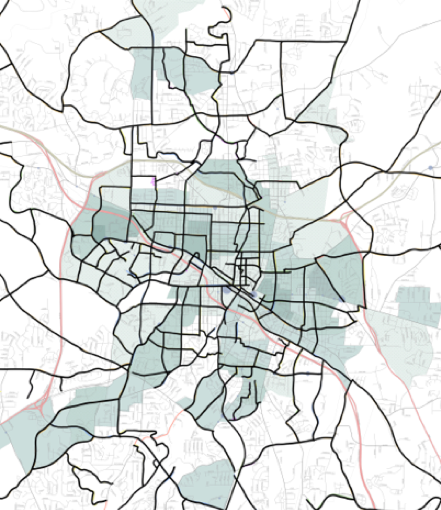
The City of Durham publishes a Bike Hike Map that details what streets feel safe to different riders and what infrastructure elements exist on different roads. On the left is a composite of the 2018 version of that map including all bike routes. Some of that is just a painted lane, some is physical infrastructure, some is street signage. Looks like a lot.
 .
. 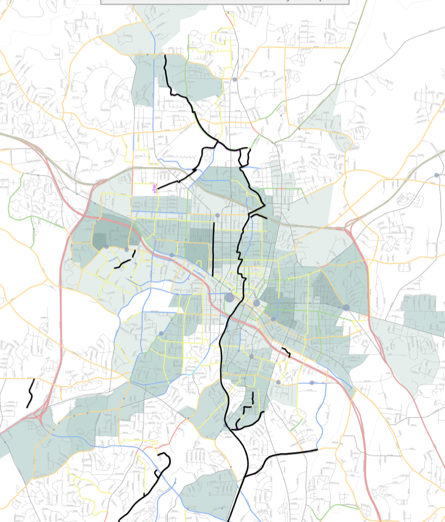
Credit: Mary Elbech of Mobycon
On the right is the same map, but it is filtered for streets that feel safe and meet specific standards.6 Not all bike infrastructure is the same and the faster the travel speed, the more infrastructure it takes to keep everyone safe. Who wants to ride in a paint-only bike lane alongside 40 mph traffic? Streets that didn’t make it to the map on the right are those with painted bike symbols, “share the road” signs, and painted bike lanes on fast roads. Those kinds of street treatments are very affordable, but they don’t do much to enhance safety — and in many cases they make the road more dangerous while creating the illusion of safety. After filtering Durham’s bike network for safe streets, what remains is mostly the North/South wooded bike path, plus a handful of unconnected segments.
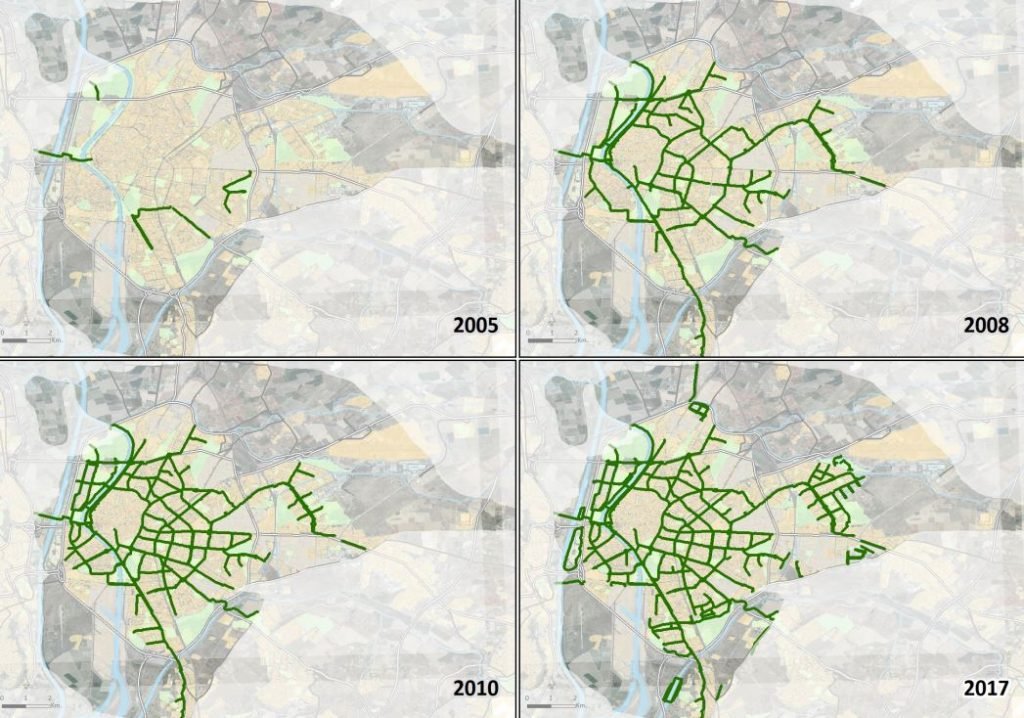
Two cities, same time frame, same amount of bike facilities, very different results. Below is a series of maps showing Seville’s rapid development of protected bike infrastructure.
There are two main factors that make Seville’s network successful.
- All the streets feel safe. Seville’s bike lanes on the map above are all physically separated from vehicle traffic. They are designed so that anyone, regardless of their age or ability, can use them without fearing for their safety. This lowers the risk of biking for everyone, and makes it much more inviting for people who want to try this mode of transportation. It makes biking more feasible and attractive for short trips to the store, commutes across town, and for families.
- It’s a network. The bike lanes in Seville take people places. They connect to other bike lanes and those lanes connect people to places they want to go. Seville created a minimum viable network that connected enough people to enough places they wanted to go.7 You need to create a network to have the network effect.
Cities need both of these to make their infrastructure useful. If you build a grand patchwork of bike facilities, some that feel safe, some that feel unsafe, only the adventurous will use them. If you build premiere protected lanes but they don’t connect to each other or to any points of interest, they aren’t very inviting. The network is only as strong as the weakest link, and unfortunately most networks are filled with gaps.
Imagine you are driving to the grocery store and the road suddenly transitions from pavement to gravel, to dirt, back to pavement. In most American cities, people who bike must deal with transitions like these because the level of safety can vary from block to block.
Unfortunately for the decision-makers involved in planning our streets, these two factors are not always obvious. Cities like Durham have been putting down bike lanes and amenities for decades but they aren’t seeing incremental results — they aren’t seeing any results. Cities like Durham won’t see results until there is a minimum viable network that feels safe for everyone. Seville has shown the world that in order to achieve ‘viral’ results, we have to make it safe and useful to bike.
Speaking of reducing barriers to transportation options, public transit fare-pricing (and even fare complexity) is a major barrier that cities could address by making their networks free to use. Josh Cohen discusses the opportunity we have with fare-free public transit here.
Check out our many case studies to learn how TransLoc is making an impact on urban and suburban mobility!
Footnotes:
1Sometimes mode share is found using the percentage of people who use a given mode as their regular transportation. The quality of this data can be complicated and it requires well-designed surveys. But measuring mode by trips taken, I think, is more revealing. Also, some places are still focusing on commute patterns when they account for mode share, which is flawed for a few reasons, the most interesting being that it perpetuates male-focused transportation planning. Another blog (or book) would dive into all these threads— for now, be satisfied with Kats Decker’s excellent article.
2For those keeping track at home that is an increase of 1,650%.
3https://www.uci.org/news/2019/seville’s-ambitious-bike-network-plan-a-success-and-growing
4https://www.portlandoregon.gov/transportation/44597?a=237507
5See future blog post about Induced Demand
6This map was specifically adjusted for streets with bike facilities that meet the design standards provided by NACTO and fall into the 8-80 standard. Not included in either map are many unmarked neighborhood streets that are likely safe to bicycle on.
7Credit to community advocate, Aidil Ortiz for coining this term